Bulk, Single-Cell or Spatial Transcriptomics: Which One Fits Your Question?
- Core Concepts
- Single-Cell RNA-seq
- Spatial Omics
- Bulk RNA-seq
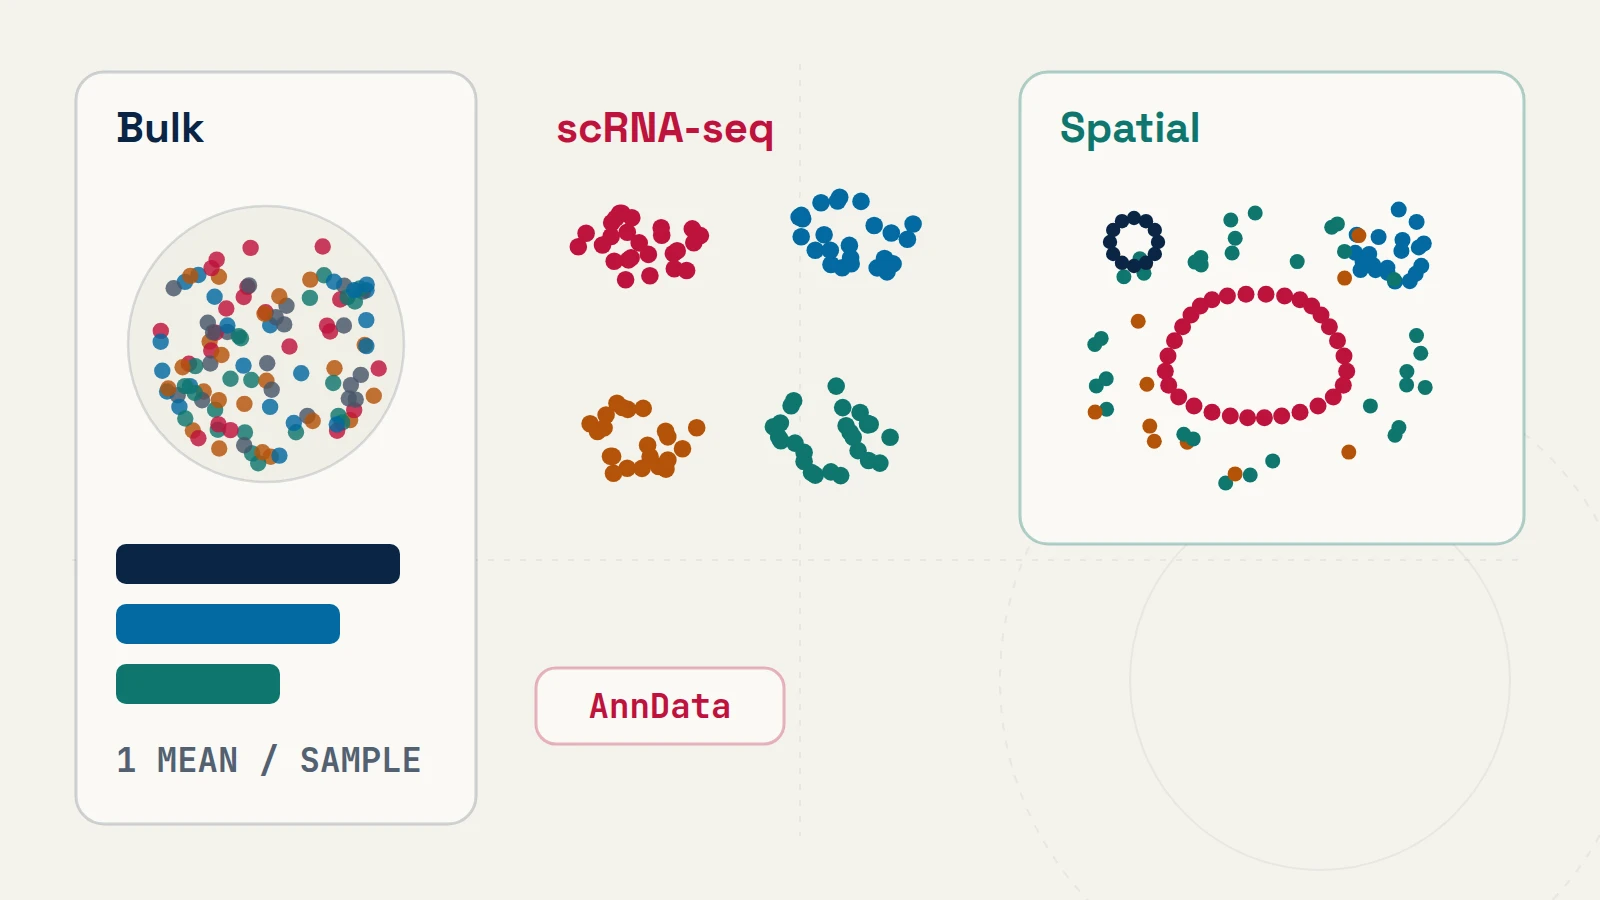
Every transcriptomics assay converts captured RNA molecules into a matrix of counts. What changes from one platform to the next is the physical entity represented by each column of that matrix: an entire homogenized specimen, an isolated cell or nucleus, or a coordinate-indexed location inside intact tissue.
Comparing physical measurement and statistical trade-offs
| Modality | Observation Unit & Sparsity | Questions Answered Best | Primary Container (R / Python) |
Key Analytical Constraint |
|---|---|---|---|---|
| Bulk RNA-seq | Genes × Samples dense integer fragment counts |
Well-powered clinical cohorts, time-courses, drug screens, isoform usage [1] | SummarizedExperiment [2] / DeseqDataSet |
Composition shifts between cell types are confounded with per-cell transcriptional changes |
Single-Cell / Single-Nucleus (scRNA-seq / snRNA-seq) |
Genes × Barcoded Droplets sparse UMI matrix |
Resolving cell states, rare subpopulations, and cell-type-specific perturbation responses [3, 4] | Seurat v5 [4], SingleCellExperiment [2] / AnnData [3] |
Tissue dissociation destroys spatial neighborhood coordinates; high per-cell zero inflation |
Spatial Transcriptomics (Xenium, CosMx, Visium HD) |
(x, y) coordinates + segmentation masks or barcoded bins |
Tumor–immune borders, niche organization, and local ligand–receptor proximity [5] | SpatialExperiment / SpatialData [5] |
Panel size vs. resolution trade-off; segmentation spillover at touching cell membranes |
Matching R and Python containers to the experimental design
Once the physical measurement unit is fixed, software selection in R and Python follows directly:
- Bulk cohorts (
nindependent samples): Keep unscaled integer counts in aSummarizedExperiment(R) orAnnDatatable (Python) and model library size offsets and negative-binomial dispersion across biological replicates withDESeq2[1] orPyDESeq2. When tissue cell-type proportions vary between groups, pair bulk expression with histopathology or reference-based deconvolution rather than attributing every fold change to intracellular regulation. - Single-cell atlases (
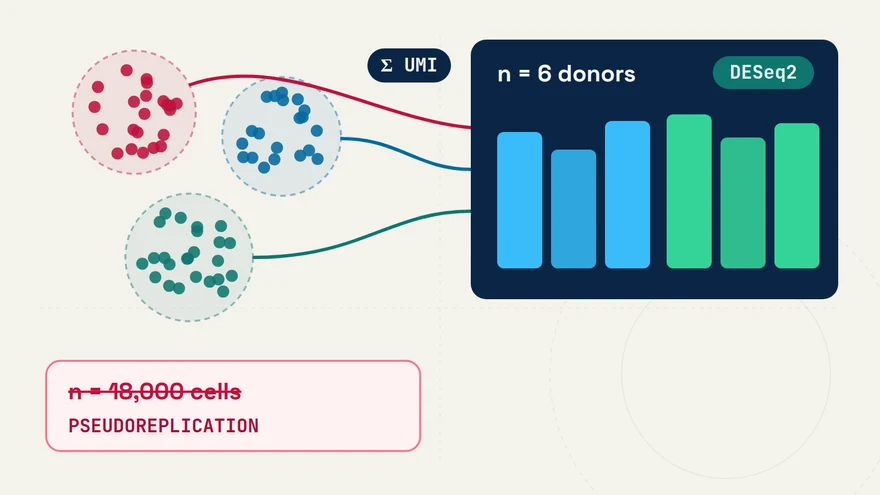
cellsnested insidedonors): UseAnnDatawithScanpy[3] orSeurat v5[4] for quality control, ambient RNA assessment, latent representation learning, and cell-state annotation—then aggregate raw integer unique molecular identifier (UMI) counts per donor before testing sample-level conditions. - Spatial tissue sections (
coordinates+images+tables): Store multi-scale pathology images, polygon masks, transcript coordinates, and count tables in one coordinate-alignedSpatialDataZarr store [5] so coordinate transformations stay synchronized from segmentation through neighborhood testing.
Using LLMs effectively when bridging modalities
When combining dissociated scRNA-seq with bulk cohorts or spatial sections, LLMs such as ChatGPT and Gemini are particularly helpful for translating gene-identifier tables (Ensembl IDs vs. HGNC symbols), aligning metadata schemas across SummarizedExperiment and AnnData, and scaffolding diagnostic visualizations. Always verify that gene filtering, normalization, and batch covariates match the assumptions of each modality’s downstream statistical model rather than applying single-cell log-normalization pipelines to bulk count tables or spatial coordinate graphs.
References & primary sources
- (2014). Moderated estimation of fold change and dispersion for RNA-seq data with DESeq2. Genome Biology 15, 550. DOI: 10.1186/s13059-014-0550-8
- (2015). Orchestrating high-throughput genomic analysis with Bioconductor. Nature Methods 12, 115–121. DOI: 10.1038/nmeth.3252
- (2018). SCANPY: large-scale single-cell gene expression data analysis. Genome Biology 19, 15. DOI: 10.1186/s13059-017-1382-0
- (2024). Dictionary learning for integrative, multimodal and scalable single-cell analysis. Nature Biotechnology 42, 293–304. DOI: 10.1038/s41587-023-01767-y
- (2024). SpatialData: an open and universal data framework for spatial omics. Nature Methods 21, 589–592. DOI: 10.1038/s41592-024-02212-x
CodingGenes (2026). Bulk, Single-Cell or Spatial Transcriptomics: Which One Fits Your Question?. CodingGenes. https://codinggenes.com/blog/bulk-vs-single-cell-vs-spatial-transcriptomics-guide/
Common questions
Why not use single-cell or spatial transcriptomics for every experiment?
Finer spatial or cellular resolution comes at the expense of per-cell sensitivity, per-sample cost, and full-length transcript coverage. A 48-sample perturbation or dose-response experiment measured by bulk RNA-seq often achieves substantially higher statistical power to detect pathway-level shifts than an under-replicated 4-sample single-cell experiment.
When is single-nucleus RNA-seq preferred over whole-cell scRNA-seq?
Single-nucleus RNA-seq (snRNA-seq) is preferred for snap-frozen archival biopsies and tissues containing fragile or elongated cells—such as neurons, adipocytes, or cardiomyocytes—that suffer dissociation bias during enzymatic whole-cell preparation, with the trade-off of capturing primarily nuclear and intronic transcripts.
How do LLMs and foundation models help across multi-modality designs?
LLMs speed up cross-container data reshaping and quality-control plotting across DESeq2, Seurat v5, Scanpy, and SpatialData, while reference-mapping tools transfer cell-state annotations from dissociated scRNA-seq atlases onto targeted spatial panels.
Continue learning with CodingGenes
Receive an email whenever a new topic, benchmark note, or YouTube lesson is published.