Pseudobulk Differential Expression in DESeq2 and PyDESeq2: Donors Are the Replicates
- Single-Cell RNA-seq
- DESeq2
- PyDESeq2
- Biostatistics
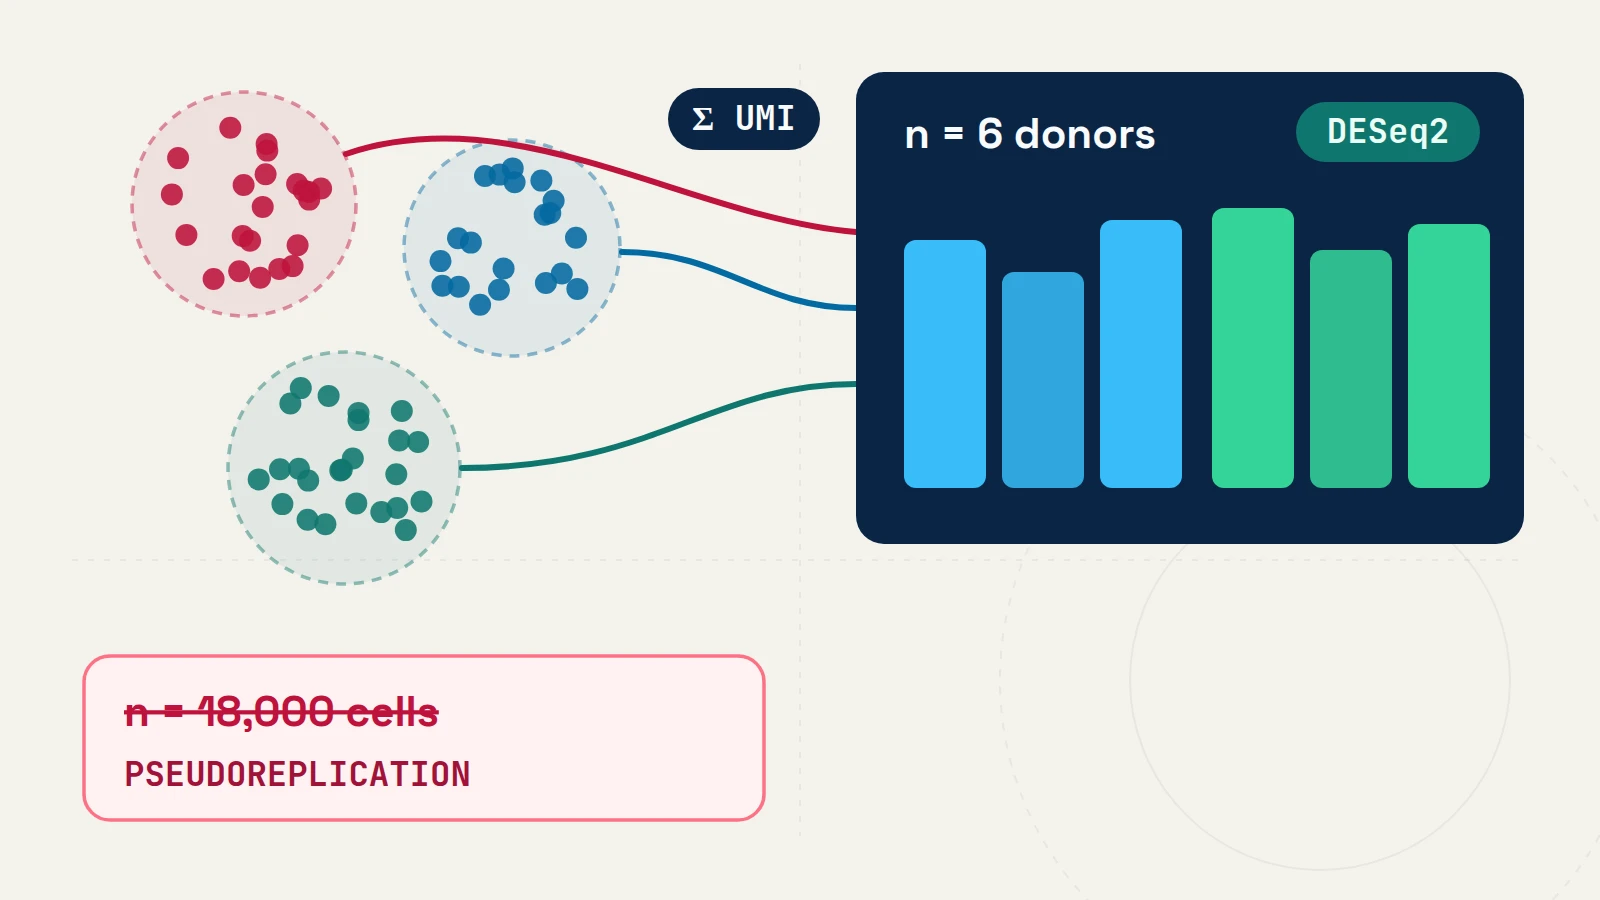
One foundational rule governs multi-sample omics inference: the statistical unit of replication must match the biological unit to which the condition or treatment was assigned [1, 2].
Why pooled cells from few donors cause pseudoreplication
Consider a worked pedagogical cohort profiling 18,000 cells across 6 individuals (3 treated patients and 3 controls, ~3,000 cells per biopsy). Because single-cell RNA sequencing (scRNA-seq) measures one transcriptomic profile per barcoded droplet, it is tempting—and common in default LLM-generated scripts—to run a two-group rank-sum test directly across all cells in a cluster (FindMarkers() in Seurat or sc.tl.rank_genes_groups() in Scanpy).
Cells isolated from the same donor share host genotype, physiological environment, tissue dissociation, and ambient RNA background, producing positive within-donor correlation [2]. Treating 18,000 correlated cells as independent replicates understates standard errors and converts ordinary baseline variation between people into minuscule p-values:
- Empirical benchmark evidence: Squair et al. (2021) audited 500
scRNA-seqpublications and benchmarked 14 differential expression (DE) methods across 18 ground-truth datasets; all 6 top-performing workflows aggregated counts into sample-level pseudobulk profiles before testing [1]. In negative-control splits of 14 unstimulated control cohorts (each with ≥ 6 healthy samples divided randomly into two groups), cell-level tests called hundreds of false-positive DE genes in the absence of biological treatment differences [1]. - Concrete human PBMC example: In the official
Seuratdifferential expression vignette on interferon-stimulated humanCD14monocytes (ifnbdataset), cell-level Wilcoxon testing identifies 1,639 genes at p < 0.05 that do not remain statistically significant after donor-levelAggregateExpression+DESeq2modeling; for example, SRGN’s p-value increases from 1.31 × 10⁻¹⁹ at the cell level to 0.182 at the donor level [6].
| Analytical Strategy | Unit Modeled as Independent (n) |
Primary Use Case | Key Trade-off / Requirement |
|---|---|---|---|
Cell-level rank test (FindMarkers / rank_genes_groups) |
Pooled cells within cluster | Exploratory marker ranking between clusters inside a single specimen | Ignores within-donor correlation; uncalibrated for cross-patient contrasts [1, 2] |
Donor pseudobulk NB-GLM (DESeq2 / PyDESeq2) |
Biological samples (donors, animals, wells) |
Comparing treatments, genotypes, or disease states assigned per sample [1, 3, 4] | Requires ≥ 3 independent samples per group; obscures cell-level variance components |
Hierarchical mixed model (GLMM with donor random effect) |
Cells nested within donors | Modeling continuous cell-level covariates in larger cohorts [2] | Higher computational cost; sensitive to random-effect specification at very small donor counts |
Prompting ChatGPT or Gemini without falling into the cell-level trap
When asked “find differentially expressed genes between treated and control in my Seurat / Scanpy object”, general-purpose LLMs frequently return FindMarkers(ident.1 = "Treated", ident.2 = "Control") because that function dominates public tutorials. To get a valid implementation on the first pass, specify four facts in your prompt:
- The column holding independent biological replicates (
donor_id), - The cell-state annotation column (
cell_type), - The raw integer unique molecular identifier (
UMI) layer (counts), and - Any technical batch covariates (
~ batch + condition).
Summing raw UMI counts in R (Seurat v5 + DESeq2)
DESeq2 estimates size factors and gene-wise negative-binomial dispersion directly from unscaled integer counts [3]:
library(Seurat)
library(DESeq2)

# 1. Sum raw integer UMI counts per (cell_type, donor_id)
pb_matrices <- AggregateExpression(
  object = seurat_obj,
  assays = "RNA",
  return.seurat = FALSE,
  group.by = c("cell_type", "donor_id", "batch", "condition")
)$RNA

# 2. Fit negative-binomial GLM on a filtered cell state (>= 15 cells & >= 1,000 UMIs per donor)
dds <- DESeqDataSetFromMatrix(
  countData = pb_cd8_counts,
  colData   = pb_cd8_meta,
  design    = ~ batch + condition
)
dds <- DESeq(dds)

# Shrink noisy low-count log2 fold changes for downstream ranking
res <- lfcShrink(dds, coef = "condition_Treated_vs_Control", type = "apeglm")
Equivalent workflow in Python (decoupleR + PyDESeq2)
In the Python scverse ecosystem, decoupler.get_pseudobulk() aggregates integer UMI counts from adata.layers["counts"] [5], and PyDESeq2 fits the negative-binomial generalized linear model (GLM) with Wald statistics and empirical Bayes shrinkage [4]:
import decoupler as dc
from pydeseq2.dds import DeseqDataSet
from pydeseq2.ds import DeseqStats

# 1. Aggregate raw integer UMI counts per (donor_id, cell_type)
pdata = dc.get_pseudobulk(
    adata,
    sample_col="donor_id",
    groups_col="cell_type",
    layer="counts",
    mode="sum",
    min_cells=15,
    min_counts=1000,
)

# 2. Subset one cell state and fit donor-level NB-GLM
cd8 = pdata[pdata.obs["cell_type"] == "CD8_Tem"].copy()
dds = DeseqDataSet(adata=cd8, design="~ batch + condition")
dds.deseq2()

stats = DeseqStats(dds, contrast=["condition", "Treated", "Control"])
stats.summary()
Diagnostics, limitations, and interpretation
- Inspect donor-level principal components before reading p-values. Plot variance-stabilized (
vst) pseudobulk profiles colored by batch, sex, and totalUMIsper sample to check whether technical covariates are collinear with treatment. - Plot per-donor stripcharts for top candidate genes. Verify that estimated fold changes reflect consistent shifts across biological replicates rather than a single high-leverage sample.
- Interpret non-significance proportionally. With small sample sizes (such as 3 vs. 3 donors), a Benjamini–Hochberg adjusted p > 0.05 reflects limited statistical power rather than proof of zero biological effect; report shrunken log2 fold-change estimates alongside their standard errors [3].
References & primary sources
- (2021). Confronting false discoveries in single-cell differential expression. Nature Communications 12, 5692. DOI: 10.1038/s41467-021-25960-2 · PMID: 34584091
- (2021). A practical solution to pseudoreplication bias in single-cell studies. Nature Communications 12, 738. DOI: 10.1038/s41467-021-21038-1 · PMID: 33531494
- (2014). Moderated estimation of fold change and dispersion for RNA-seq data with DESeq2. Genome Biology 15, 550. DOI: 10.1186/s13059-014-0550-8
- (2023). PyDESeq2: a python package for bulk RNA-seq differential expression analysis. Bioinformatics 39(9), btad547. DOI: 10.1093/bioinformatics/btad547
- (2022). decoupleR: ensemble of computational methods to infer biological activities from omics data. Bioinformatics Advances 2(1), vbac016. DOI: 10.1093/bioadv/vbac016
- (2024). Seurat v5 Official Vignette: Differential expression testing (ifnb human PBMC dataset). Seurat Documentation. Documentation
CodingGenes (2026). Pseudobulk Differential Expression in DESeq2 and PyDESeq2: Donors Are the Replicates. CodingGenes. https://codinggenes.com/blog/pseudobulk-differential-expression-seurat-pydeseq2/
Common questions
How many biological replicates are needed for pseudobulk differential expression?
Plan for at least 3 to 4 independent biological samples per condition as a bare minimum for dispersion estimation, with substantially higher statistical power at 6 or more donors per group. Retain a cell type in a given sample only when enough cells and total UMIs are captured (commonly at least 15 to 20 cells and 1,000 total UMIs) to avoid extreme count sparsity.
Should pseudobulk aggregation sum raw integer UMI counts or log-normalized expression?
Always sum unscaled integer UMI counts (the counts layer in Seurat v5 Assay5, or adata.layers['counts'] in AnnData). Negative-binomial generalized linear models such as DESeq2 and PyDESeq2 model library size offsets and count-mean dispersion directly from integer counts.
Does a non-significant donor pseudobulk p-value prove a gene is unchanged?
No. Statistical non-significance (for example p > 0.05) indicates that observed differences are compatible with donor-to-donor variability at the available sample size; in small cohorts (such as n = 3 vs. 3), power to detect modest fold changes is limited, so inspect shrunken log2 fold-change intervals alongside adjusted p-values.
Continue learning with CodingGenes
Receive an email whenever a new topic, benchmark note, or YouTube lesson is published.