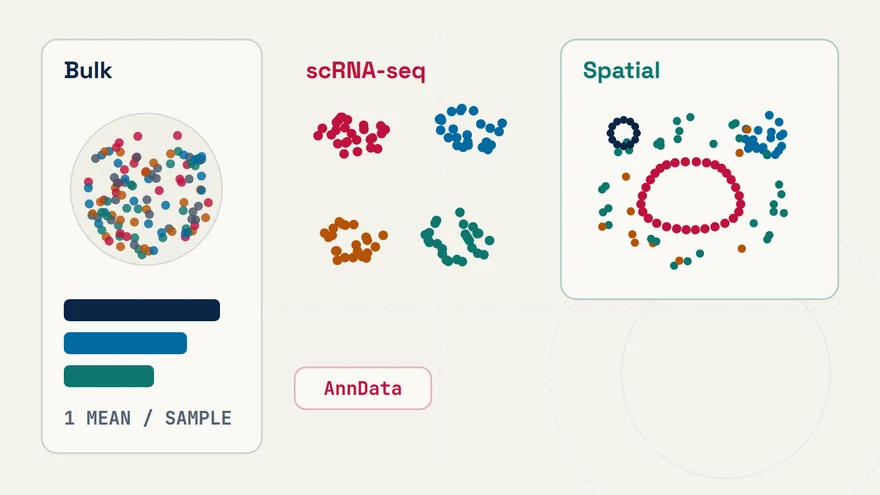
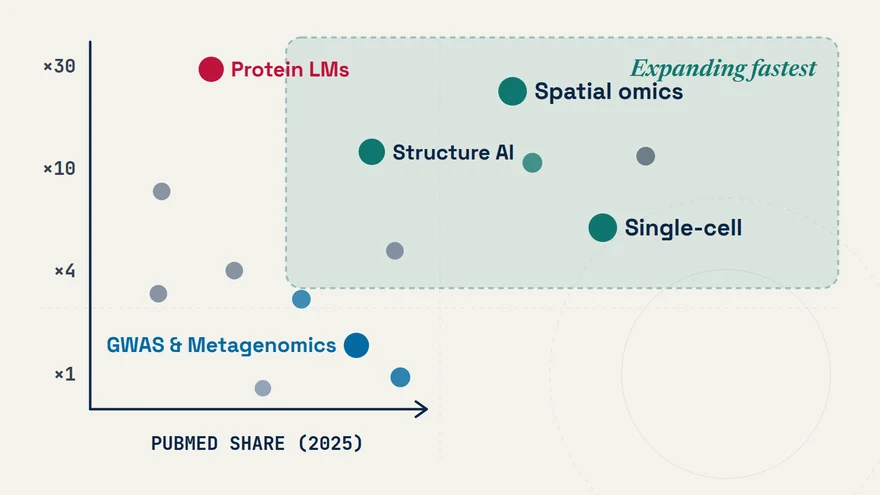
Spatial Transcriptomics Assays: Imaging (Xenium, CosMx) vs. Sequencing (Visium HD)
- Spatial Transcriptomics
- Xenium
- CosMx
- Visium HD
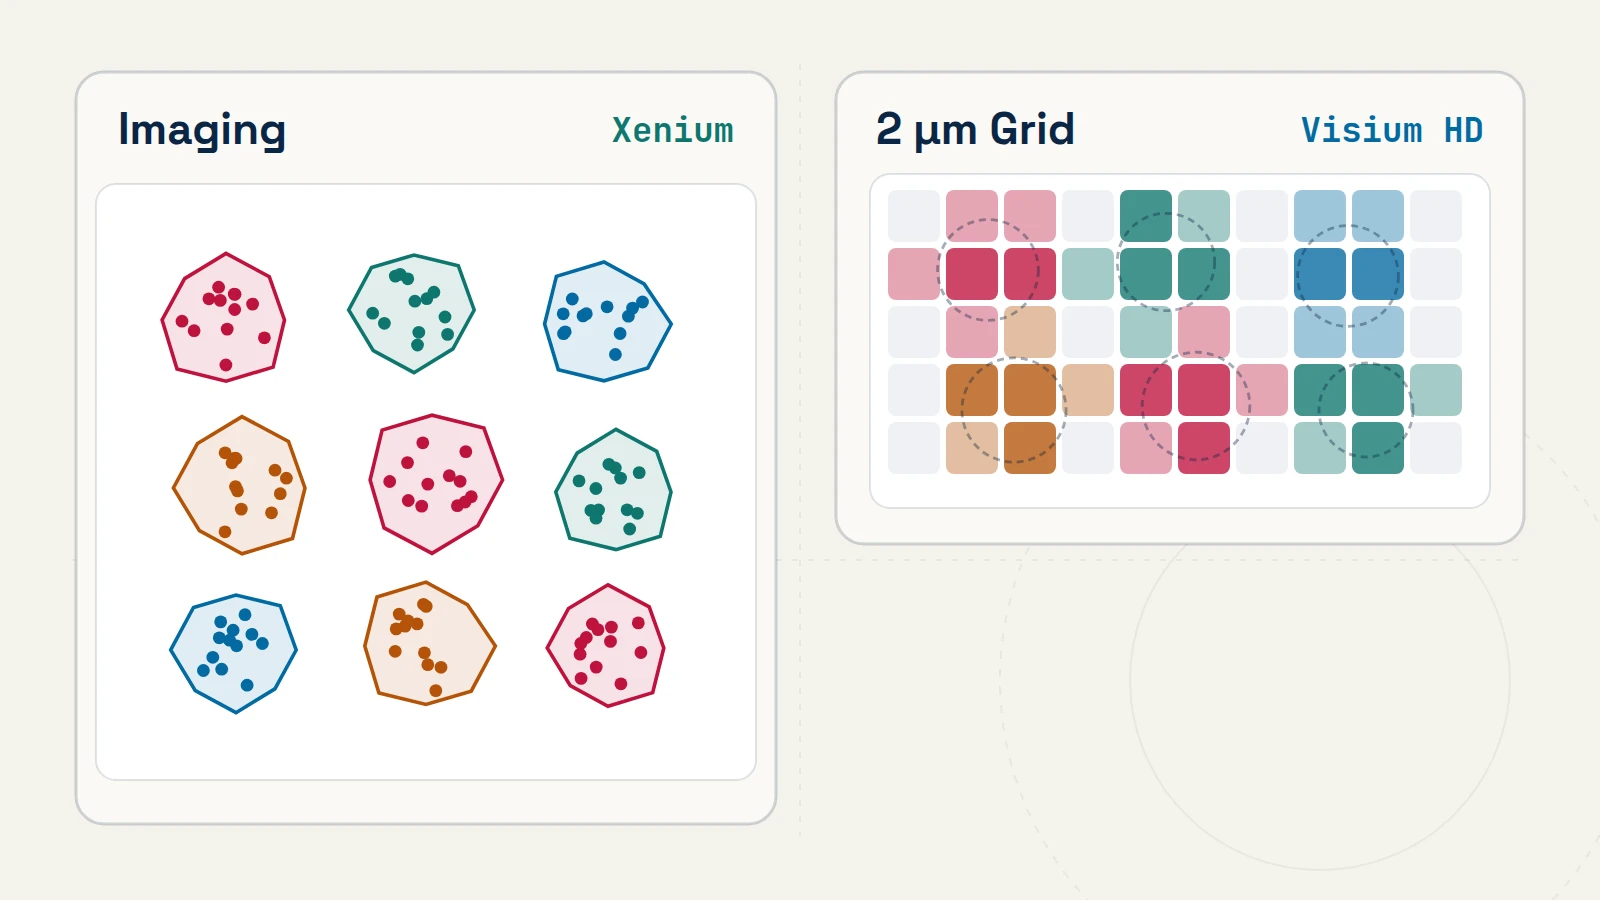
Before running spatial clustering, niche discovery, or ligand–receptor scoring, every computational analysis has to account for one physical step: how RNA molecules inside a tissue section were converted into spatially indexed counts [1–3].
Optical in situ imaging versus high-density spatial barcoding
Modern subcellular and near-cellular platforms fall into two physical measurement classes [1–3]:
| Assay Property | Targeted In Situ Imaging (Xenium, CosMx) |
High-Density Spatial Barcoding (Visium HD) |
|---|---|---|
| Physical Capture Mechanism | Padlock / cyclic in situ hybridization (ISH) with optical decoding of individual fluorescent puncta [1, 2] |
Probe hybridization on tissue followed by transfer onto a continuous lawn of 2 µm × 2 µm spatially barcoded squares and sequencing [3] |
| Feature Breadth | Targeted gene panels (~300 to multi-thousand pre-selected genes) [1, 2] |
Whole human or mouse protein-coding probe set (~18,000 genes) [3] |
| Primary Experimental Strength | High molecular detection sensitivity for predefined cell states and pathways; direct intracellular transcript coordinates [1] | Unbiased transcriptome-wide discovery when relevant pathways or markers are not known prior to the experiment [3] |
| Dominant Source of Assignment Error | Misassigning border transcripts across touching cells when membranes are unstained or poorly segmented | Lateral transcript diffusion and grouping sparse 2 µm squares (commonly binned to 8 µm or segmented nuclei) into single cells [3] |
| Open-Source Ecosystem | SpatialData [4] · Squidpy [5] · Seurat v5 · SpatialExperiment |
Space Ranger · SpatialData [4] · Squidpy [5] · SpatialExperiment |
Three verification checks before trusting LLM-generated spatial pipelines
When you ask an LLM assistant to generate a Squidpy or Seurat spatial workflow, standard code templates treat the segmented cell-by-gene table just like dissociated scRNA-seq plus an (x, y) centroid column. Run three physical checks before interpreting biological claims:
- Treat cell polygons as uncertain estimates, not ground truth. Whenever an unexpected lineage marker appears in an infiltrating immune or stromal cluster (for example, epithelial EPCAM counts inside
CD3E+T cells), visualize the raw transcript coordinates overlaid on nuclear and membrane channels inSpatialData[4]. Transcripts concentrated strictly along the outer polygon rim indicate segmentation spillover from an adjacent cell rather than a novel dual-lineage state. - Condition spatial permutation nulls on tissue anatomy. Running
sq.gr.nhood_enrichment()with unconstrained whole-slide label permutations [5] tests whether two cell types deviate from uniform placement across the entire section. If two populations both reside in mucosal crypts or perivascular stroma, whole-slide permutation yields small p-values driven by shared macro-anatomy rather than local cell–cell interaction. Permute cell labels within matched histological compartments, and replicate across independent tissue donors. - Account for panel censorship in targeted imaging. Pathway enrichment or ligand–receptor inference on a 400-gene panel reflects both tissue biology and which genes were included during panel design; report the background universe explicitly as the assayed gene panel rather than the full genome.
References & primary sources
- (2023). High resolution mapping of the tumor microenvironment using integrated single-cell, spatial and in situ analysis. Nature Communications 14, 8353. DOI: 10.1038/s41467-023-43458-x
- (2022). High-plex imaging of RNA and proteins at subcellular resolution in fixed tissue by spatial molecular imaging. Nature Biotechnology 40, 1794–1806. DOI: 10.1038/s41587-022-01483-z
- (2025). High-definition spatial transcriptomic profiling of immune cell populations in colorectal cancer. Nature Genetics 57, 1512–1523. DOI: 10.1038/s41588-025-02193-3
- (2024). SpatialData: an open and universal data framework for spatial omics. Nature Methods 21, 589–592. DOI: 10.1038/s41592-024-02212-x
- (2022). Squidpy: a scalable framework for spatial omics analysis. Nature Methods 19, 171–178. DOI: 10.1038/s41592-021-01358-2
CodingGenes (2026). Spatial Transcriptomics Assays: Imaging (Xenium, CosMx) vs. Sequencing (Visium HD). CodingGenes. https://codinggenes.com/blog/spatial-transcriptomics-platforms-xenium-cosmx-visium-hd/
Common questions
What tissue quality checks matter most before running FFPE spatial transcriptomics?
Evaluate RNA fragment integrity—commonly the percentage of RNA fragments longer than 200 nucleotides (DV200)—and inspect H&E or immunofluorescence morphology on a pilot section. Formalin fixation cross-linking and tissue detachment directly constrain probe hybridization efficiency and membrane segmentation.
Why do infiltrating T cells or macrophages sometimes appear to express epithelial tumor markers in spatial datasets?
When cells touch in dense tumor nests, isotropic nuclear-expansion boundaries extend into neighboring epithelial cytoplasm and capture adjacent EPCAM or keratin transcripts. Overlaying raw molecule coordinates onto a membrane stain distinguishes boundary spillover from genuine co-expression.
Continue learning with CodingGenes
Receive an email whenever a new topic, benchmark note, or YouTube lesson is published.